EVALUATION OF DIFFUSION-WEIGHTED IMAGING AND APPARENT DIFFUSION COEFFICIENT MAPPING USING DIFFERENT B-VALUES FOR MAGNETIC RESONANCEGUIDED FOCUSED ULTRASOUND SURGERY: A PRELIMINARY STUDY FOR UTERINE FIBROID AND ADENOMYOMA
DOI:
https://doi.org/10.22452/jummec.vol20no2.3Keywords:
Apparent Diffusion Coefficient (ADC), Diffusion-Weighted Imaging (DWI), Magnetic Resonance- Guided Focused Ultrasound (Mrgfus), Magnetic Resonance Imaging (MRI), Uterine Fibroid And AdenomyomaAbstract
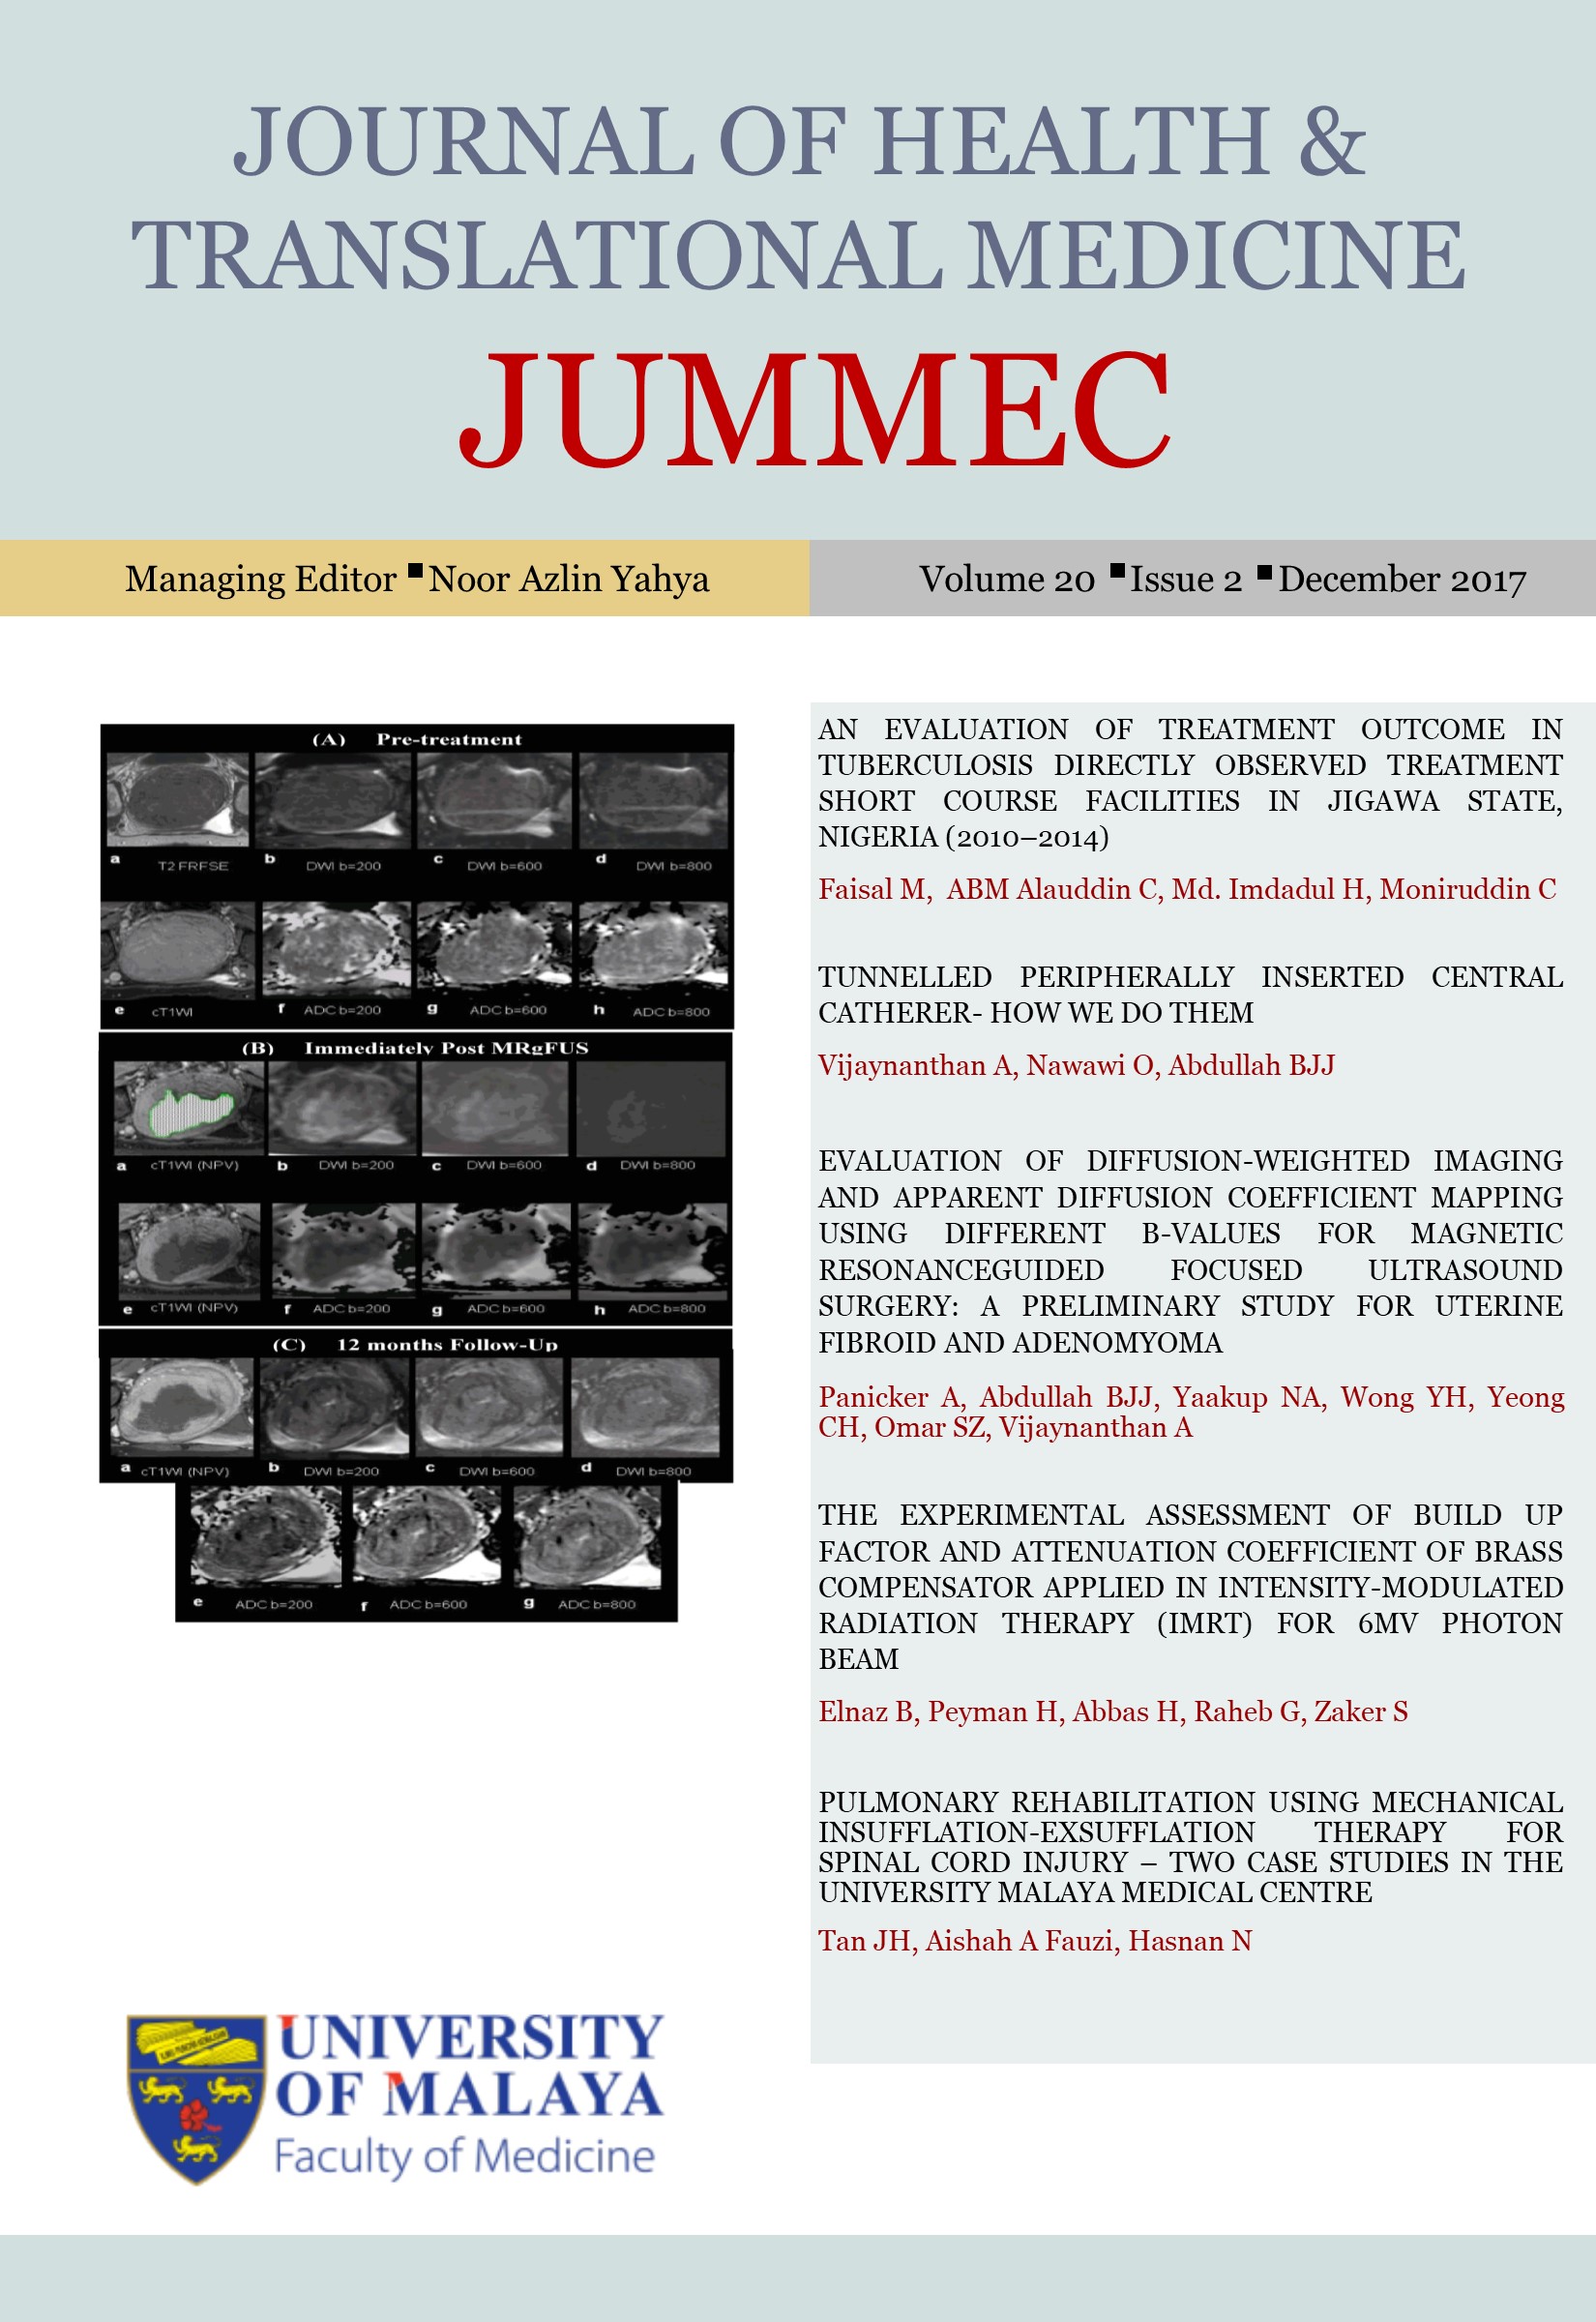
The study was taken to assess the feasibility of diffusion-weighted imaging (DWI) and apparent diffusion coefficient (ADC) mapping using different b-values for magnetic resonance-guided focused ultrasound (MRgFUS) treatment of uterine fibroid and adenomyoma. The contrast-enhanced T1-weighted image (cT1WI) as well as DWIs and ADC maps of different b-values (i.e. 200, 600 and 800 s/mm²) were obtained from nine fibroid and five adenomyoma patients, immediately after, and 12 months after MRgFUS treatment. The image contrast score, non-perfused volume (NPV) and NPV ratio obtained were compared to determine the feasibility of DWI and ADC mapping for MRgFUS treatment outcome evaluation. Our finding showed that immediately after MRgFUS treatment, the DWI acquired using 200 s/mm² b-value gave the highest image contrast score among all other b-values. The NPV calculated from DWI of 200 s/ mm² showed the best correlation (R² = 0.938) with post-contrast NPV. At 12 months follow-up, there was no specific b-value considered as significantly superior to others in terms of image contrast. However, the NPVs and NPV ratios obtained from all DWIs and ADC maps of different b-values were in good agreement with the post-contrast NPV and NPV ratio. We observed that the DWI, particularly obtained with a low b-value (i.e. 200 s/mm²), is feasible for delineation and quantitative volumetric evaluation of the ablated region immediately after the MRgFUS treatment. At 12 months follow-up, both DWIs and ADC maps are feasible for NPV and NPV ratio calculation.
Downloads
Published
Issue
Section
License
All authors agree that the article, if editorially accepted for publication, shall be licensed under the Creative Commons Attribution License 4.0 to allow others to freely access, copy and use research provided the author is correctly attributed, unless otherwise stated. All articles are available online without charge or other barriers to access. However, anyone wishing to reproduce large quantities of an article (250+) should inform the publisher. Any opinion expressed in the articles are those of the authors and do not reflect that of the University of Malaya, 50603 Kuala Lumpur, Malaysia.